Zoë Randall Teacher Leadership Digital Portfolio
Methods
Data Collection
In my work with the entire 6th grade class, I chose to focus on one class of 27 students whom I taught during the last period of the school day. I chose this class randomly, and focused further on a group of focus students who would help me to discover how different students were experiencing the digital storytelling project. Out of six focus students, I decided to write cases on four in an attempt to give further insight into the student experience. I tried a variety of methods to help me understand student perceptions through collecting data at various points in the project. In using these results, I was able to analyze what stories students wanted to tell and why, as well as how they experienced the digital storytelling process and the process of sharing their stories with others.
Surveys
The survey data I collected helped me track how students were experiencing the digital story project. I collected preliminary data from the entire 6th grade (112 students) using Survey Monkey. I used Google forms to conduct later surveys with my 5th period class (27 students).
The preliminary survey (Appendix A) gave me a chance to understand my students’ perceptions about identity, storytelling, sharing, and community. This survey also provided me information about who kids wanted to tell a story about based on questions I asked them such as the example below:
If you could tell everyone in the world one story, what story would you tell?
(A) A story about me
B) A story about a family member
(C) A story about a friend
(D) A story about someone in my community
As I reviewed the responses to this question and others, I rephrased the questions in future surveys to relate them to what stories kids would tell and why they wanted to share those stories.
Exit Cards
I used both virtual and paper exit cards to get more detailed information regarding classroom activities related to my research. Paper exit cards ranged from asking students to rate a project experience, to sharing reflections after an interview process, and telling me what story they were going to develop into their digital stories. The following are examples of exit card questions:
What’s one thing that struck you from conducting an interview with your partner today?
What’s one thing you learned about yourself today through being interviewed?
If you could tell everyone in the world one story, what story would you tell?
My story
A story about a family member
My friend’s story
The story of someone amazing in my community
Virtual exit cards emailed out to students helped me gather more immediate information from them in a spreadsheet format which could be utilized for deeper analysis.
Interviews/Focus Groups
To gain more insight into what happened when students used digital storytelling, I conducted small group and individual interviews. I was interested in finding out how students viewed the process of digital storytelling from beginning to end. I examined what ideas, questions, and experiences came out of the process for individual students. In conducting interviews at the midpoint, and post-project stages of the digital story project, I learned about how students used digital storytelling and how their thinking evolved in regards to identity, empathy and community.
A sample question on identity:
What do you consider a good personal story?
A sample question on empathy:
Did this project help you share yourself?
A sample question on community:
What did you think about meeting in a circle of chairs at the start of each class?
I chose students to interview who told very different digital stories and who had different experiences in sharing their stories. Some of these students became cases in my study representing different approaches students took to the project. These students also represented the range of diversity in the classroom based in technological knowledge, gender, and race. In the end I had a diverse group who experienced the project in very different ways.
Student Work Samples
Along the way, I evaluated student work, such as their life road maps, Storycorps interviews, and digital story script drafts, digital stories and final reflections. These helped inform me about how students were experiencing different modes of storytelling, and how they were choosing stories to tell. I collected data at various points in my research. The following table represents the data collection cycle:
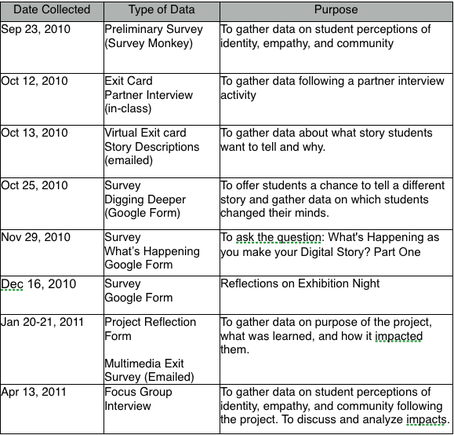
Figure 2. Data Collection chart
Data Analysis
Surveys
The survey data I collected helped me track how students were experiencing the digital story project. I collected preliminary data from the entire 6th grade (112 students) using Survey Monkey. I used Google forms to conduct later surveys with my 5th period class (27 students), which collected each students email address so I could easily identify their responses within a spreadsheet for easy analysis. Open-ended questions could be read in a spreadsheet, and other data could be sorted into graphs and percentages. I only wish that it had further analysis tools to help track word frequency.
As I analyzed the data from one survey, it informed the questions I asked on future ones. For example, the digging deeper survey asked students:
What will I gain personally from telling this story?
What will others gain from telling this story?
If I could change my story what now would be the story I want to tell and why?
From this survey, students began to reveal the reasoning behind the stories they wanted to tell. The lessons they wanted to communicate also emerged at this stage. At this point, I knew how students felt about the stories they wanted to tell and why. I coded survey data for key word frequency in their statements which led to emerging themes. I also graphed quantitative data to show trends in storytelling.
Exit Cards
Exit cards helped me most in making immediate changes to inform my practice the next day. Although I experimented with virtual exit cards as an alternative to getting immediate feedback on student thinking, only 60-70% of my students replied, even when given class time to respond. Paper exit slips held students more accountable to giving feedback. From these, I was able to pull out themes in what students were thinking about the stories they wanted to tell, how they experienced activities in class, and what they learned that day.
Interviews/Focus Groups
I transcribed video recorded interviews with focus students to help me gain more insight into how they progressed through the digital storytelling process. I was particularly interested in how their answers reflected current attitudes towards digital storytelling, comfort levels with storytelling, relationships with peers, family members and the greater community. I asked questions relating to the process and found that as I compared different students' responses to interview questions, themes emerged relating to empathy and sharing stories.
Work Samples
Student work samples helped me identify which students to focus on as case studies of different approaches to digital storytelling. By comparing data from collected life road maps, interviews, digital story scripts, final digital stories and reflections, I was able to find out different themes regarding how students experienced digital storytelling and see changes over time in the stories they had to tell.
